In the third, and last, part of the Google Analytics 102 series we go over Events: Track The Actions That Drive Your Business.
Events are something of a Swiss Army knife within the Google Analytics tool box.
If you can detect an action like a click, form submission, or mouse movements such as scrolling, then you can send it as an event to Google Analytics.
Implementing Event tracking allows you to track many previously untrackable aspects of your website, like:
- video plays/pauses
- file downloads
- checking filter boxes
And any other interaction that doesn’t result in a new pageview.
It also opens up a set of reports within Google Analytics. Anna Lewis created a helpful 101 introduction to these reports over at Search Engine Watch if you need more help on how these built-in reports work.
Quick Facts About Events
- 4 parts are used for Event tracking: Category, Action, Label, and Value. Label and Value are optional parts.
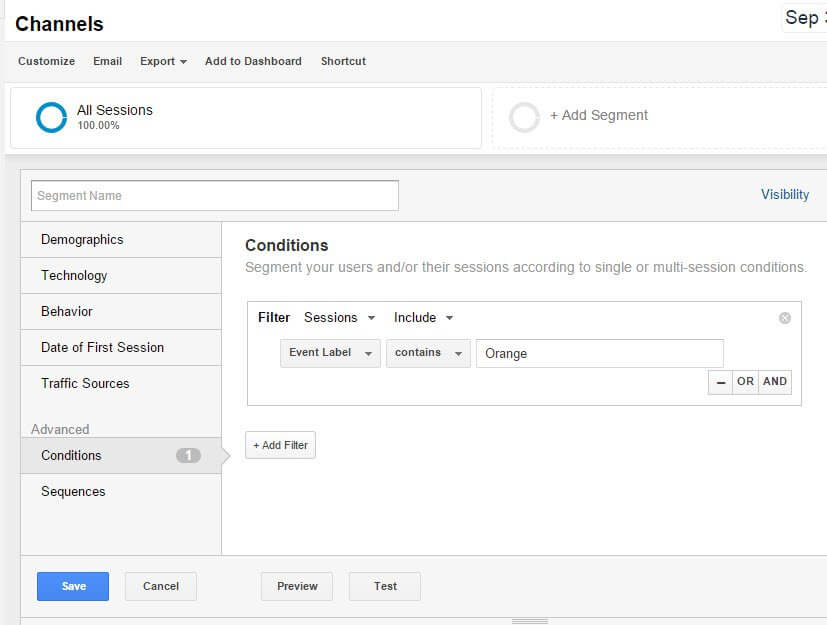
- Goals and Segments can be created using Event data.
- Events can be implemented without coding through Google Tag Manager.
- Bounce rate is reduced by default when using Events.
- GA can only track 500 events per session.
By default, the only activity that Google logs on your site has to do directly with visits and pageviews. It can track where a visitor came from, where a visitor is located, what device they used, how many pages they visited, which pages, and how much time was spent.
This is fantastic information that can be turned into Goals and Segments that allow you to slice your data into meaningful pieces.
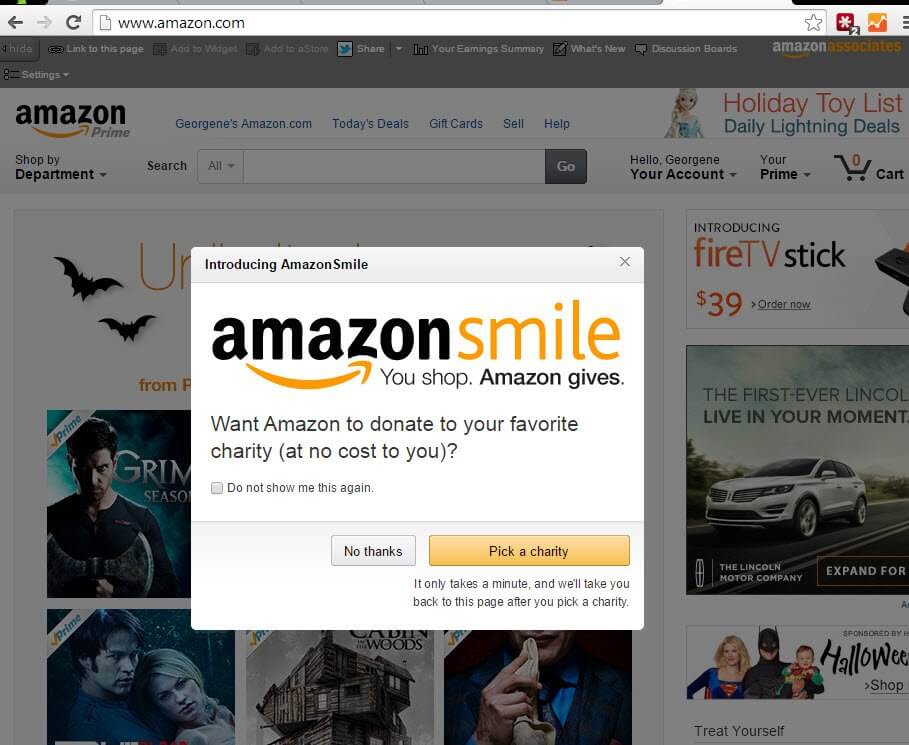
Amazon.com home page from 10/31/14
See that pop up window? You can track the checkbox that says “do not show me this again” the “no thanks” button and the “pick a charity button” (as well as the X and if a user clicks outside the modal window to close it) by using Events tracking.
Events go beyond the standard visitor data to help you answer detailed questions about user behavior:
- Did people watch my video?
- Events can log flash & video events such as play, pause, and time watched.
- At what point are people abandoning my form?
- Event tracking can be used to show completed vs abandoned forms, which fields were filled out, and which were skipped.
- Are people using the share buttons?
- You can use Events to track these, capturing the share type, the social platform, and other details.
- Is the popup/modal window effective at driving more interaction or sales?
- Events can track non-pageload or AJAX clicks to show you who clicked the “yes” button and who clicked to close your pop up.
- Do people who use search filters spend more money?
- Log search filter use as an Event and create Segments from the filter data you capture to separate your Ecommerce data. (Hint: Category as “Filter”; Action as the Filter group, e.g. “shoe size”; Label as the specific filter clicked, e.g. “9.5” or “8”.)
- Do people who download my free ebook also fill out the form?
- Track file downloads as Events; then create a Goal for your form’s thank you page. Use custom Segments to show you which portion of your visitors downloaded and then converted, and which didn’t. (COMBO MOVE!)
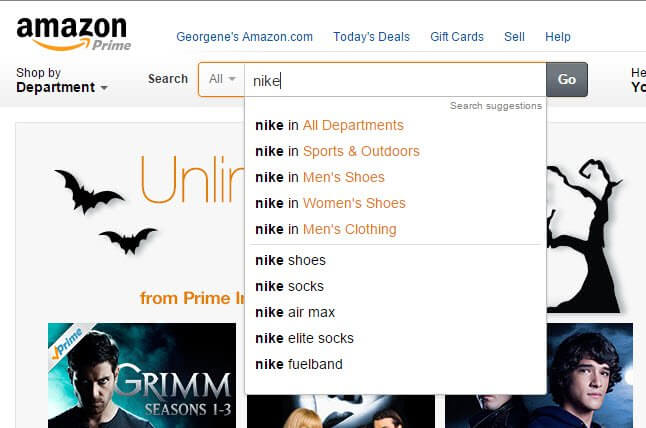
Amazon.com search bar – Events tracking could be used to track which auto complete option a user selected (or if they just hit enter or the search button). Amazon could capture which Departments are most often clicked in search suggestions, or the search terms themselves!
How Do We Set Up Events?
Before you can start building reports on that information, you have to capture it.
There are many methods you can use to implement Event tracking on your website. They’re about as varied as your site itself, because it involves implementing new code.
Implementation can be handled in a number of ways:
- Google Tag Manager (easy; find out how)
- WordPress plugin (easy)
- Yoast Google Analytics (premium ecommerce extension available also)
- Universal Google Analytics
- Manual one-time link tagging (easy; generate tags for classic GA)
- Custom javascript implementation to automatically track (difficult, requires code knowledge; check out this jQuery tracking generator that turns this method from difficult to easy!)
Bottom line: there are a lot of different methods for tracking Events, and it’s up to you and your site development team to figure out which one will be the best fit for your site.
But before you roll out a single line of code, you should think about one of the most critical set up concerns of Events:
- What are we tracking?
- Why are we tracking it?
- How do we set up the labels so they will be meaningful in our reports?
See, the code isn’t actually that hard to implement. But good organization of how you’ll structure the information hierarchy so it’s useful could be challenging.
By default you get 3 labeling buckets:
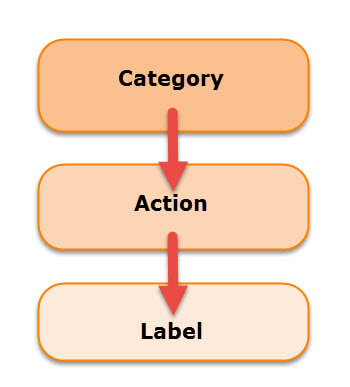
Treat these as you would matryoshka dolls, keep the big ideas that hold the most small details on the outside, in Category. Think of this as the most generic noun that applies to your event.
- Outbound Links
- Files
- Videos
- Forms
It doesn’t necessarily have to be that broad, for example, if you know you’re going to have a limited number of files for download, you might choose whitepaper, ebook, and custom report as your top level Category values.
Next comes the Action data point, which should encompass the action that was done on your site, such as:
- download
- call (as in click to call… because you DO have your phone numbers wrapped in tel: links… right?)
- submit
- play / pause (for video)
- share
And of course, like with Category, Action doesn’t have to be fully generic, and it doesn’t even have to be an action! If you have an action that has three distinct tiers of information, you could structure it more like this:
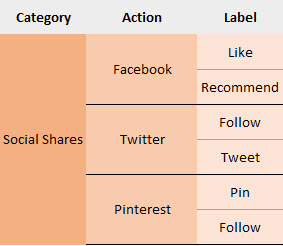
By structuring your labels that way you could compare social channels at the Action level, and use the Label level for the specific social actions.
Or, you could flip that organization on it’s head, like this:
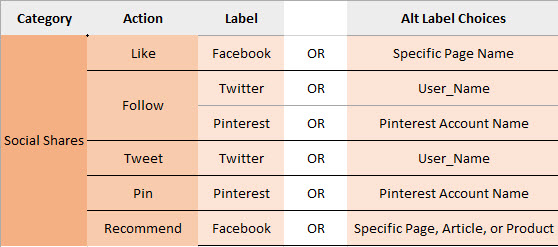
This way, the social actions are all treated as as the Action, and the Label becomes either the platform, such as Twitter or Pinterest, or you could get really specific with your Labels and call out which page was liked, or which account was tweeted at, etc.
So far so good. The important thing is to make sure you pick one Category/Action schema and stick to it.
Labels are the last tier of, well, labeling your Events. This is where the granular, specific information goes. Say you had a form that allowed people to pick their favorite color as part of a poll to determine your new product line.
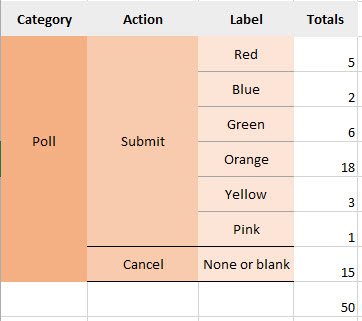
At the Category level, you could see that 50 people interacted with your poll, the total number of interactions with your Event called Poll.
At the Action level, you could see that 15 people “cancelled” or abandoned your form, and 35 people submitted a form.
At the Label level, you would be able to see which specific poll options were the most popular. (We now know it’s Orange by a landslide!)
But you won’t be able to have any kind of meaningful insights or reports if you aren’t consistent with your labels. Take the time, sit down, and come up with the following details before you roll out Events tracking:
- What are we tracking?
- What are the highest level things? aka what do we use as Categories?
- What are the actions or second-tier things we need to track? aka what are ourActions?
- What are the small details we want to capture? aka what are the Labels?
Now if you discover a hierarchy you set up isn’t working out the way you’d like it to, then by all means change it, but make sure you make these types of changes consistently, so you don’t end up with a mix of conflicting data points.
It will be worth the work for all the ways you’ll be able to leverage your data. And don’t be afraid to discontinue Event tags that are no longer useful, like temporary ones used to detect on-site errors after a feature change. Rogue, orphaned, or mistakenly collected data will only slow you down.
Takeaways
Events are a versatile and powerful way to add interaction data to your reports. You can build Goals based on Event data to treat on page interactions as conversions. You can build Segments around them to answer questions like “do users who experience errors still convert?” or “which pages are my social sharing buttons being used on most?”.
But like all powerful tools that let you add data, you have to have consistency and firm idea of what questions you intend to answer with the data, or you risk collecting junk data. Stay diligent with your naming conventions!
Bonus: Check out this in-depth guide by Anna Lewis on events, their uses, and how to implement them. (It’s a little dated, as the code examples still reference Classic GA, but still valuable for the methods and use cases outlined.)
Double bonus: Jim Gianogilo created a slick jQuery based method of measuring form input that can help you track which fields users are avoiding, or at what point users are abandoning forms.